Dredge: Firmware Vulnerability Triage Pipeline
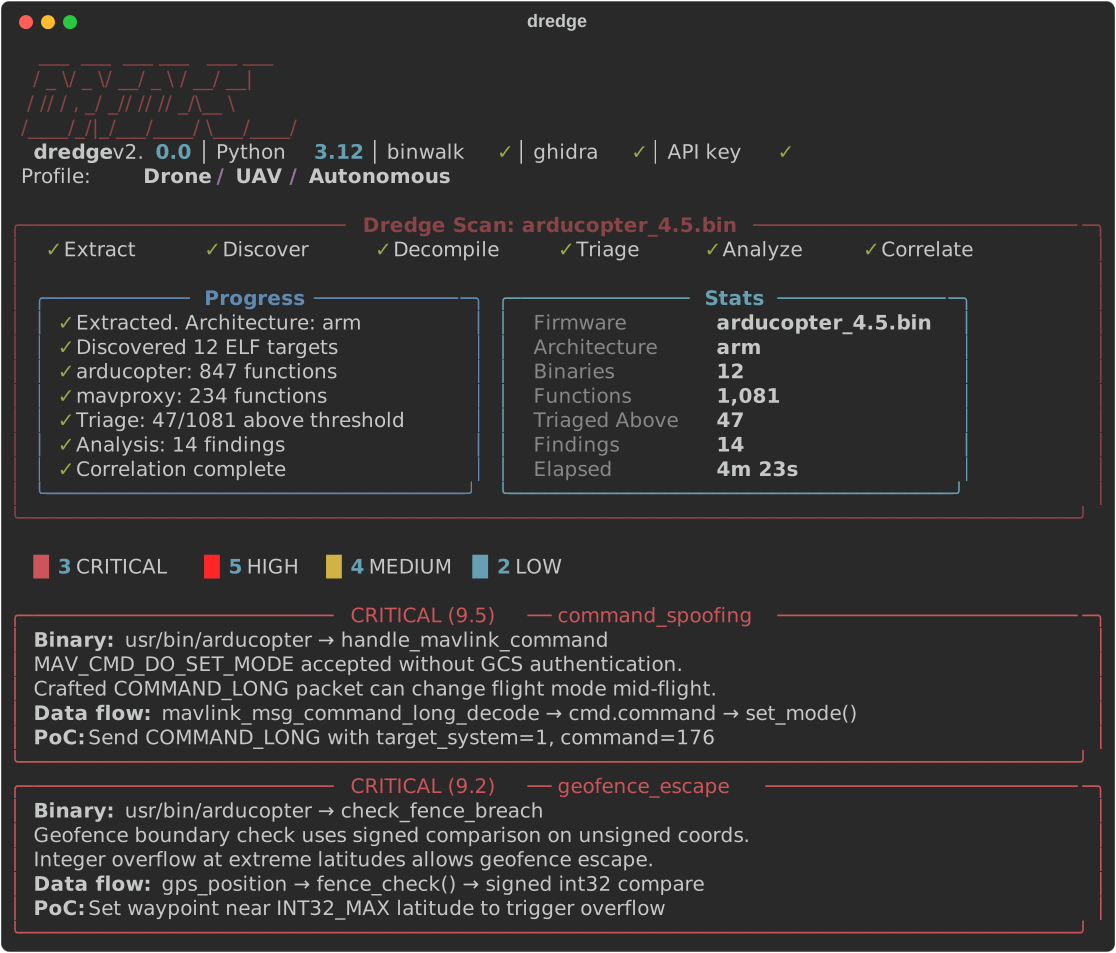
Dredge is a firmware vulnerability triage pipeline. It turns a raw firmware image or ELF binary into a ranked review queue by extracting targets, decompiling them, scoring risky functions, and sending only the strongest candidates to Claude for bounded vulnerability analysis.
Goal
Firmware review fails when every decompiled function looks equally urgent. Dredge’s goal is to reduce that pile into a small, explainable set of functions worth human attention. The project is built around deterministic triage first, LLM review second. Claude is not the discovery engine. It is the slower analyst stage after Dredge has already found binaries, decompiled functions, collected context, and assigned scores.
Pipeline
The scan path is a staged pipeline:
- Extract firmware with
binwalk, then locate the filesystem root. - Discover targets by walking the extracted tree and prioritizing ELF binaries, scripts, and security-relevant config files.
- Decompile ELF targets with Ghidra headless.
- Score every decompiled function with local heuristics.
- Analyze functions above the triage threshold with Claude.
- Deduplicate, correlate, and report findings as terminal output, Markdown, or JSON.
Raw ELF inputs skip extraction and discovery. They are registered directly and enter the same decompile, triage, analyze, and correlate stages.
Scoring and triage
Triage is a local scoring pass, not an API call. Each function gets a 0 to 100 score. Very small functions and compiler-generated entries are dropped early. The scorer adds weight for dangerous sinks such as system, popen, execve, sprintf, strcpy, gets, and memcpy. It adds more weight for network and user-input patterns such as CGI handlers, HTTP headers, recv, read, NVRAM access, hardcoded credentials, and format-string shapes.
Profiles tune the same mechanism for different firmware families. The IoT profile prioritizes web management binaries, NVRAM-backed configuration, update paths, and router services. The drone profile adds MAVLink parsing, arming checks, failsafe logic, geofences, parameter changes, and motor-output paths. Server and satellite profiles add their own binary names, input patterns, vulnerability classes, and prompt context.
Only functions at or above the configured threshold, default 30, enter the Claude stage. That keeps the expensive analysis path tied to an auditable score instead of a blanket “send everything to the model” loop.
Ghidra integration
Dredge drives Ghidra through analyzeHeadless and a project-local decompile_functions.py script. The script runs Ghidra analysis, decompiles non-external functions to pseudo-C, records function addresses and sizes, exports call edges, collects string references, and lists imports. Each binary runs in a temporary Ghidra project with a configurable timeout. The pipeline stores decompiled functions and strings in SQLite before triage, so later stages do not depend on keeping the Ghidra process alive.
Analysis boundaries
The Claude stage receives a single function, target metadata, one level of called-function context, string references, and profile-specific vulnerability classes. Responses are parsed as structured findings and discarded if they do not match the allowed classes or confidence shape.
That makes Dredge a triage tool, not proof of exploitability. It can point at command injection, memory-safety patterns, credential handling, update paths, or control-flow risks, but the output still needs manual review, reproduction, and target-specific exploit constraints. The page does not claim coverage, recall, runtime speed, or false-positive rates because the repository does not include measured benchmark results for those claims.
Attack-chain correlation
The correlator treats individual findings as leads, then sorts and reshapes them into a review order. It deduplicates repeated findings by vulnerability class, binary, and function. It boosts severity when hardcoded credentials and authentication bypass appear in the same binary, and it gives high-confidence command injection an extra bump. The goal is simple: surface combinations that could form a real attack path before isolated low-context findings.
Resumability and state
Scan state lives in SQLite with WAL mode enabled. Dredge records firmware hashes, extraction paths, binary metadata, decompiled functions, triage scores, analysis status, findings, call graph edges, and strings. A repeated scan of the same firmware hash returns the existing record unless forced.
The pipeline is resumable by stage. Ctrl+C marks the scan interrupted, stops the dashboard cleanly, and prints a dredge rescan command for the saved firmware ID and stage. Cached function findings can be reused, so a later run does not have to re-query already analyzed functions.
Limitations
Dredge depends on Ghidra’s decompiler quality, available symbols, extracted filesystem shape, and the heuristics in the selected profile. Scripts and config files are discovered, but the implemented analysis path is centered on ELF decompilation and function-level review. Call-graph context is intentionally shallow. The scoring rules are transparent and tunable, but they are still heuristics, not a guarantee that low-scoring code is safe.